Component Design
UX Case Study: Chart Component for Data Analysis App
While working for Rosen, I was involved in projects for the ROAIMS Application Suite, an asset management system for the oil and gas industry. This case study focuses on a project developed for the stress analysis data app.
Details
Client: Rosen
Duration: 1 month (2013)
Categories
- UX Design
- Front-end Development
Challenge
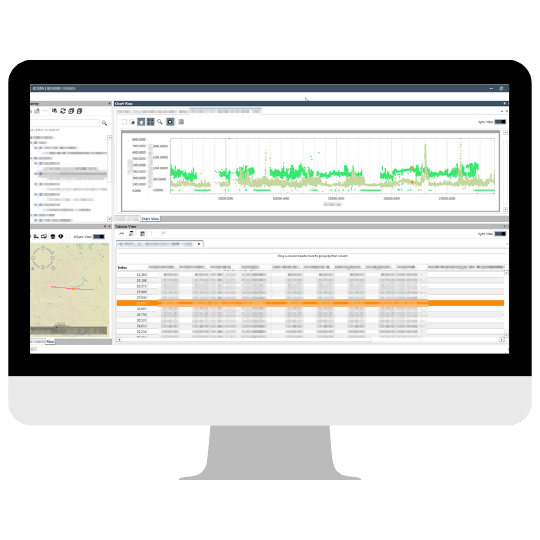
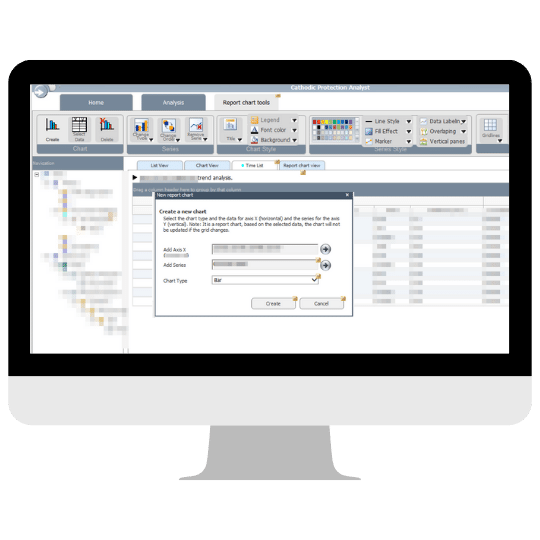
As a key part of the development team for the Stress Analyst app, we faced a new client requirement: the need to integrate a dynamic graphical visualization of the already-generated reports into the table views.
The primary goal was to design a component that could be reused in other applications within the Suite. From a user perspective, the charts were intended to visually complement the information and facilitate decision-making.
Understanding the User
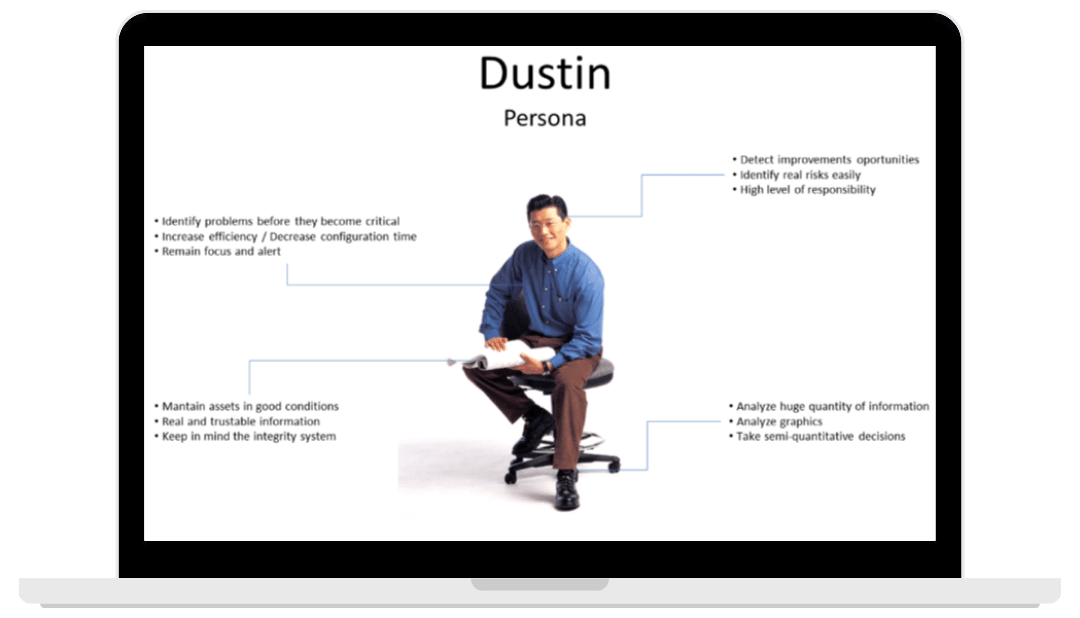
To understand the users’ needs, we conducted thorough research, including stakeholder interviews and technical document analysis. We identified Dustin as our primary user: a proactive engineer seeking to increase efficiency and make data-driven decisions. With these findings, we defined clear design requirements and set goals for creating and displaying charts, ensuring consistency and flexibility in our solutions.
Interaction Design
To design according to user needs and assess technical feasibility, I closely collaborated with the developers, creating paper wireframes and discussing ideas to seamlessly integrate the new requirement into the existing application.
Since this element was not yet part of the design system, I worked in parallel to expand the design system while outlining our vision for the product.
User workflow representations in UML were used to visualize the process, and digital prototypes were developed in AxureRP.
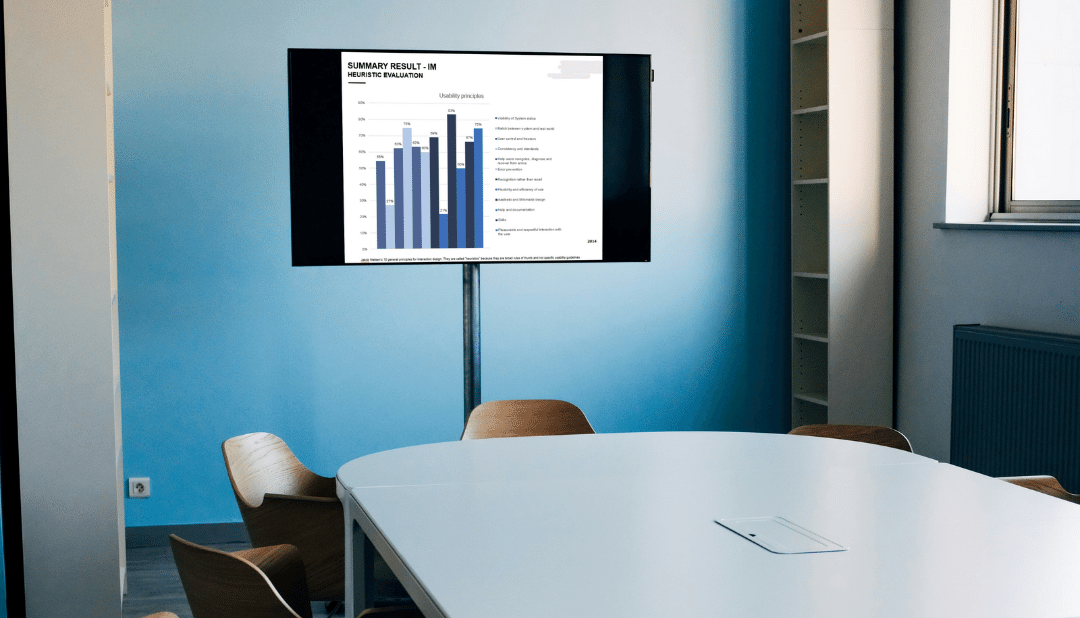
Later, I evaluated the prototype through a heuristic evaluation to ensure usability and design harmony.

Impact
In this project, as in others, we successfully expanded the design system and automated the icon library.
The chart component was well received by stakeholders and clients, generating positive feedback during the annual meeting. This project marked my departure before maternity leave, and I felt grateful to hear it mentioned at such an important event.

Lessons Learned
From this project, I gained valuable insights:
- Chart representation.
- Customization.
- Consistency.
Additionally, I understood the importance of generating clear documentation for developers in my absence.
In this case study, we will explore an example of UX design for an oil and gas asset management application.
¡Conectemos!
Estoy emocionada por colaborar y descubrir cómo podemos trabajar juntos para alcanzar tus objetivos. ¡Me encantaría conversar!
